Understanding the Navigation Stack

This morning I wrote about a bug in Corgi Corral that I’d been dealing with for a few months. The act of writing about it was apparently just what my brain needed in order to sort it out, and as it happens, it was a real rookie mistake! I’m hoping that by explaining the problem (and solution), I might help other beginners like me.

I started my previous post by explaining Corgi Corral’s navigation stack:

Main Menu –> Scene Selection –> GameViewController –> Score Summary

Basically, the game’s view controllers should always be in that order. From the main menu, you progress to a level selection screen, then to the game itself, and finally to a summary of your score. From there, you should only move backwards through the stack. In other words, the “retry level” button should pop the score summary off the stack and move back down to the game controller. The “choose a different level” button should pop two view controllers off the stack and go all the way back to the Scene Selection screen.

Here’s where I went wrong: in my Storyboard, on the Score Summary screen, I accidentally hooked up the “choose a different level” button to a “Show” segue instead of an “unwind” segue. This caused the following to happen:

Main Menu -> Scene Selection -> GameViewController -> Score Summary -> Scene Selection

In other words, a brand new “Scene Selection” controller was pushed onto the stack. The problem was compounded each time I selected a new level:

Main Menu -> Scene Selection -> GameViewController -> Score Summary -> Scene Selection -> GameViewController -> Score Summary -> Scene Selection -> GameViewController

You can see how after playing a few games, this got way out of hand. There were multiple GameViewControllers in existence that still had references to game scenes. The memory growth, however, was somehow still negligible despite all of these duplicates.

So how did I diagnose the problem? By using simple print debugging. In the viewWillAppear method of each view controller I printed out the entire navigation stack like so: print(navigationController.viewControllers). Then I watched the output as I played a few games. As soon as I saw new controllers being added to the stack, I knew I was in trouble.

The solution was to make sure I was using an unwind segue to move backwards through the stack after the user selected an option from the Score Summary screen.

I know, I know…dumbest mistake ever. But now at least I know that there will only ever be four view controllers in existence at one time in my app. I hope someone can learn from this!
HELP! Squash a Bug, Save a Corgi [Updated]

UPDATED 3-12-16, 2:04PM CST:  I’ve actually been trying to figure out this bug for months, and, of course, as soon as I posted about it I figured it out. :D As it turns out, I made a real rookie mistake and messed up my Storyboard segues. I’m going to write a follow-up post explaining what happened…hopefully it will benefit other beginners like me!

Ok y’all, I’ve finally run into a bug that I can’t figure out, which means: the fate of Corgi Corral is in your hands. I’m posting here first, but if I don’t get a response, I’ll try Stack Overflow.

The Bug

Corgi Corral’s navigation stack is set up in a Storyboard and works like this:
Main Menu –> Scene Selection –> GameViewController –> Score Summary

From the Score Summary, the player can either retry the current scene, pick another scene, or return to the main menu.

The bug, which causes the app to slow to a stutter but not crash, occurs when I play four games in a row and then try to start a fifth. So, like this:

  1. Play Level 1 – all good, game plays at 60fps
  2. Play Level 4 – also good, game plays at 60fps
  3. Play Level 3 – things are still great, 60fps
  4. Play Level 2 – excellent performance here as well, 60fps
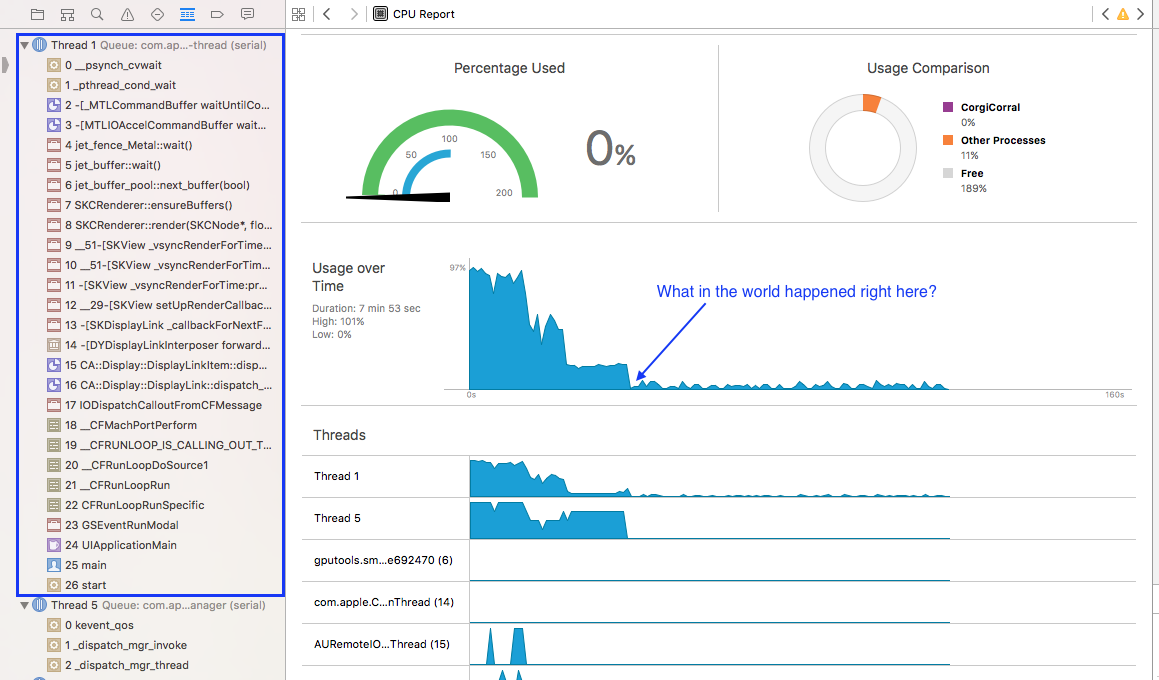
  5. Play Level 1 — when I return to Level 1, the segue between the Scene Selection screen and the GameViewController suddenly slows to a snail’s pace, the game’s framerate drops to 1fps, activity on all threads plummets, and the overall CPU usage drops to just about nothing. The Level1.sks file seems to load properly, everything is just slow.

The bug also occurs if I retry one of the scenes (so like: 2, 3, 1, 1, 2) instead of playing four different ones.

Since a crash never actually occurs, I paused execution right after the slowdown and took this screenshot of the debug navigator (click to enlarge):

debug navigator

However, I can’t make any sense of it. All I know is that I don’t seem to have a memory leak.

The Trace

I opened up the Time Profiler and recorded myself playing four games and then starting a fifth. I saved the trace, which you can download from Dropbox. (Note: it’s a 50MB file, since it took me about 6 minutes to reach the bug). The problem occurs right around the 5:15 timestamp.

Theories

I’m not experienced enough to be able to debug a problem like this. But I’m guess it has something to do with threading? Or texture loading? Or both? All of my scenes are loaded from .sks files. All of my sprite images are in the asset catalog (which, from what I understand, is necessary for app thinning and should behave like a texture atlas as of iOS 9). I’m not doing any on-demand resource loading. I don’t have any code related to Grand Central Dispatch. The game is accelerometer-controlled, so CPU-usage is naturally high during playtime. When I try to start that fifth game though, it’s like the accelerometer just gives up. Am I hitting some kind of system limit?

Comments are open, because I’m desperate. I’ll update this post with any additional information requested, and also if a solution is found. Thanks in advance!

Finding My App’s Memory Leak

My plan was to write a quick post explaining how I figured out the source of my app’s memory leak; however, I’ve run into two problems: 1) I think my app actually has a few other minor leaks, so I didn’t fix it completely and 2) the “Allocations” instrument in the latest Xcode beta is absolutely refusing to work now, so I can’t recreate what I saw the other day and take screenshots. As soon as I’m done writing this, I’m going to file a radar because I was able to reproduce the crash using Apple’s own sample game, DemoBots.

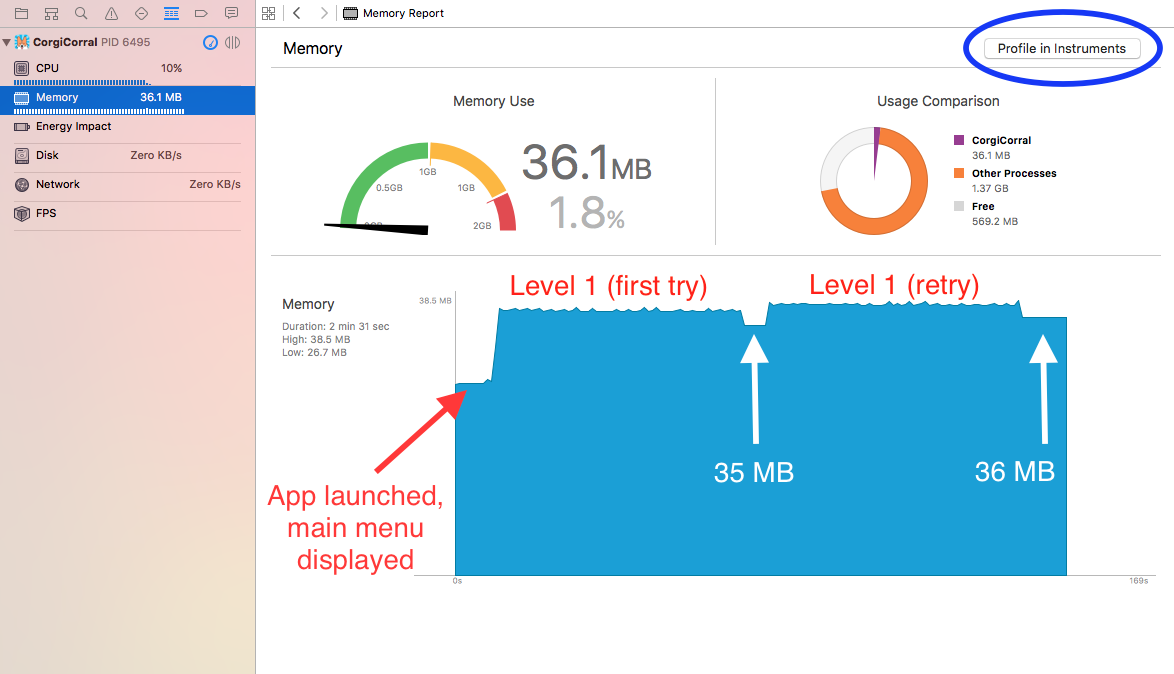
Anyway, there are still a couple things I can show you. First, I ran Corgi Corral on my iPhone 6S and played the same level twice. In between levels, the app transitions to another view controller that gives a summary of your score. As you can see, the second time I played the level the app used more memory than before. Each time I hit “retry,” it increased ever so slightly.

Debug navigator

If I hit the “Profile in Instruments” button during gameplay, my app would immediately crash (which is why I’m filing a radar). However, for awhile I was able to get the “Allocations” tool to collect data on the score summary screen. Now, I can only get it to run on the main menu without crashing.

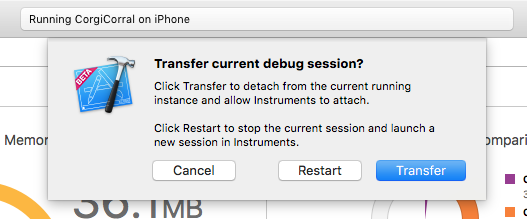
Transfer to Allocations

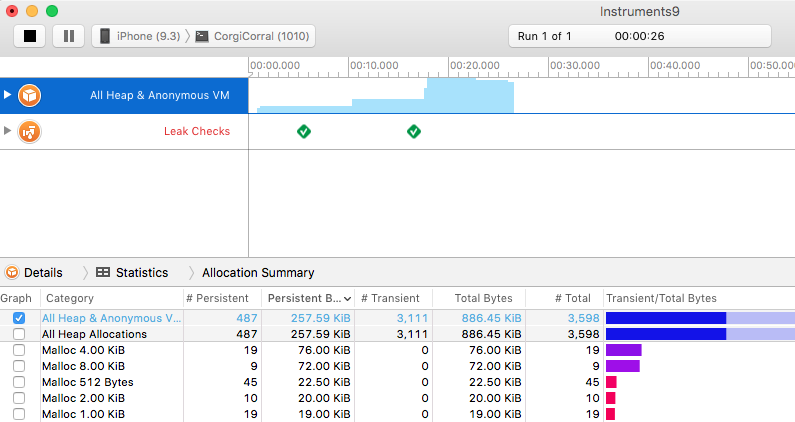
For what it’s worth, it doesn’t matter whether I select “transfer” or “restart” — the app still crashes, except on the main menu, where I can at least show you what the memory-analyzing tool looks like when it’s running:

Allocations and leaks

See those little green checkmarks next to “Leak Checks”? When I reached my score summary screen, those were showing up as red icons with an “x” in the middle. When I clicked the red icon, it showed me a list of objects that weren’t being deallocated. The list included many instances of “GKAgent2D,” “GKGoal,” “GKBehavior,” “GKComponentSystem”—enough instances to cover the number of sheep in the level. Evidently, even though the SKSpriteNodes were being removed from the scene (and their agents from the scene’s agent system) when the sheep entered the pen, their GameplayKit agents were refusing to die.

I’m hoping that the next beta of Xcode 7.3 will fix my profiling problem, because I’ve become really interested in learning how to analyze my game’s performance! I’m sure there are many more problems to be found and optimizations to be made. For now, I’m off to file a bug report!