UPDATED 3-12-16, 2:04PM CST: I’ve actually been trying to figure out this bug for months, and, of course, as soon as I posted about it I figured it out. :D As it turns out, I made a real rookie mistake and messed up my Storyboard segues. I’m going to write a follow-up post explaining what happened…hopefully it will benefit other beginners like me!
Ok y’all, I’ve finally run into a bug that I can’t figure out, which means: the fate of Corgi Corral is in your hands. I’m posting here first, but if I don’t get a response, I’ll try Stack Overflow.
The Bug
Corgi Corral’s navigation stack is set up in a Storyboard and works like this:
Main Menu –> Scene Selection –> GameViewController –> Score Summary
From the Score Summary, the player can either retry the current scene, pick another scene, or return to the main menu.
The bug, which causes the app to slow to a stutter but not crash, occurs when I play four games in a row and then try to start a fifth. So, like this:
- Play Level 1 – all good, game plays at 60fps
- Play Level 4 – also good, game plays at 60fps
- Play Level 3 – things are still great, 60fps
- Play Level 2 – excellent performance here as well, 60fps
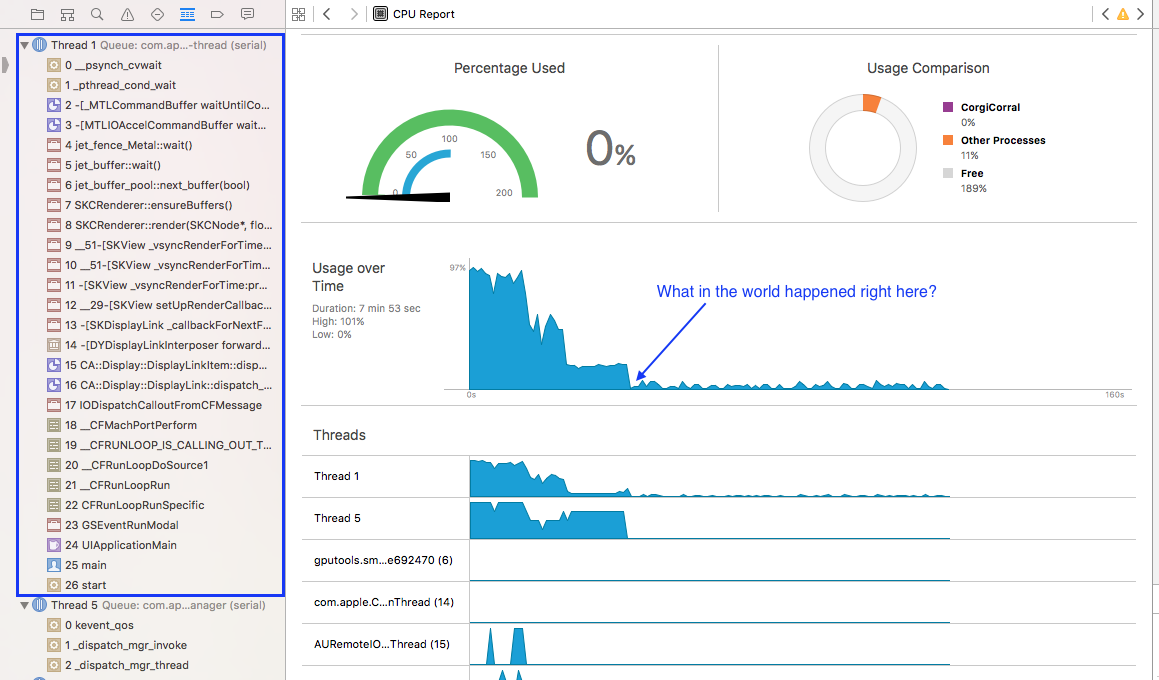
- Play Level 1 — when I return to Level 1, the segue between the Scene Selection screen and the GameViewController suddenly slows to a snail’s pace, the game’s framerate drops to 1fps, activity on all threads plummets, and the overall CPU usage drops to just about nothing. The Level1.sks file seems to load properly, everything is just slow.
The bug also occurs if I retry one of the scenes (so like: 2, 3, 1, 1, 2) instead of playing four different ones.
Since a crash never actually occurs, I paused execution right after the slowdown and took this screenshot of the debug navigator (click to enlarge):
However, I can’t make any sense of it. All I know is that I don’t seem to have a memory leak.
The Trace
I opened up the Time Profiler and recorded myself playing four games and then starting a fifth. I saved the trace, which you can download from Dropbox. (Note: it’s a 50MB file, since it took me about 6 minutes to reach the bug). The problem occurs right around the 5:15 timestamp.
Theories
I’m not experienced enough to be able to debug a problem like this. But I’m guess it has something to do with threading? Or texture loading? Or both? All of my scenes are loaded from .sks files. All of my sprite images are in the asset catalog (which, from what I understand, is necessary for app thinning and should behave like a texture atlas as of iOS 9). I’m not doing any on-demand resource loading. I don’t have any code related to Grand Central Dispatch. The game is accelerometer-controlled, so CPU-usage is naturally high during playtime. When I try to start that fifth game though, it’s like the accelerometer just gives up. Am I hitting some kind of system limit?
Comments are open, because I’m desperate. I’ll update this post with any additional information requested, and also if a solution is found. Thanks in advance!